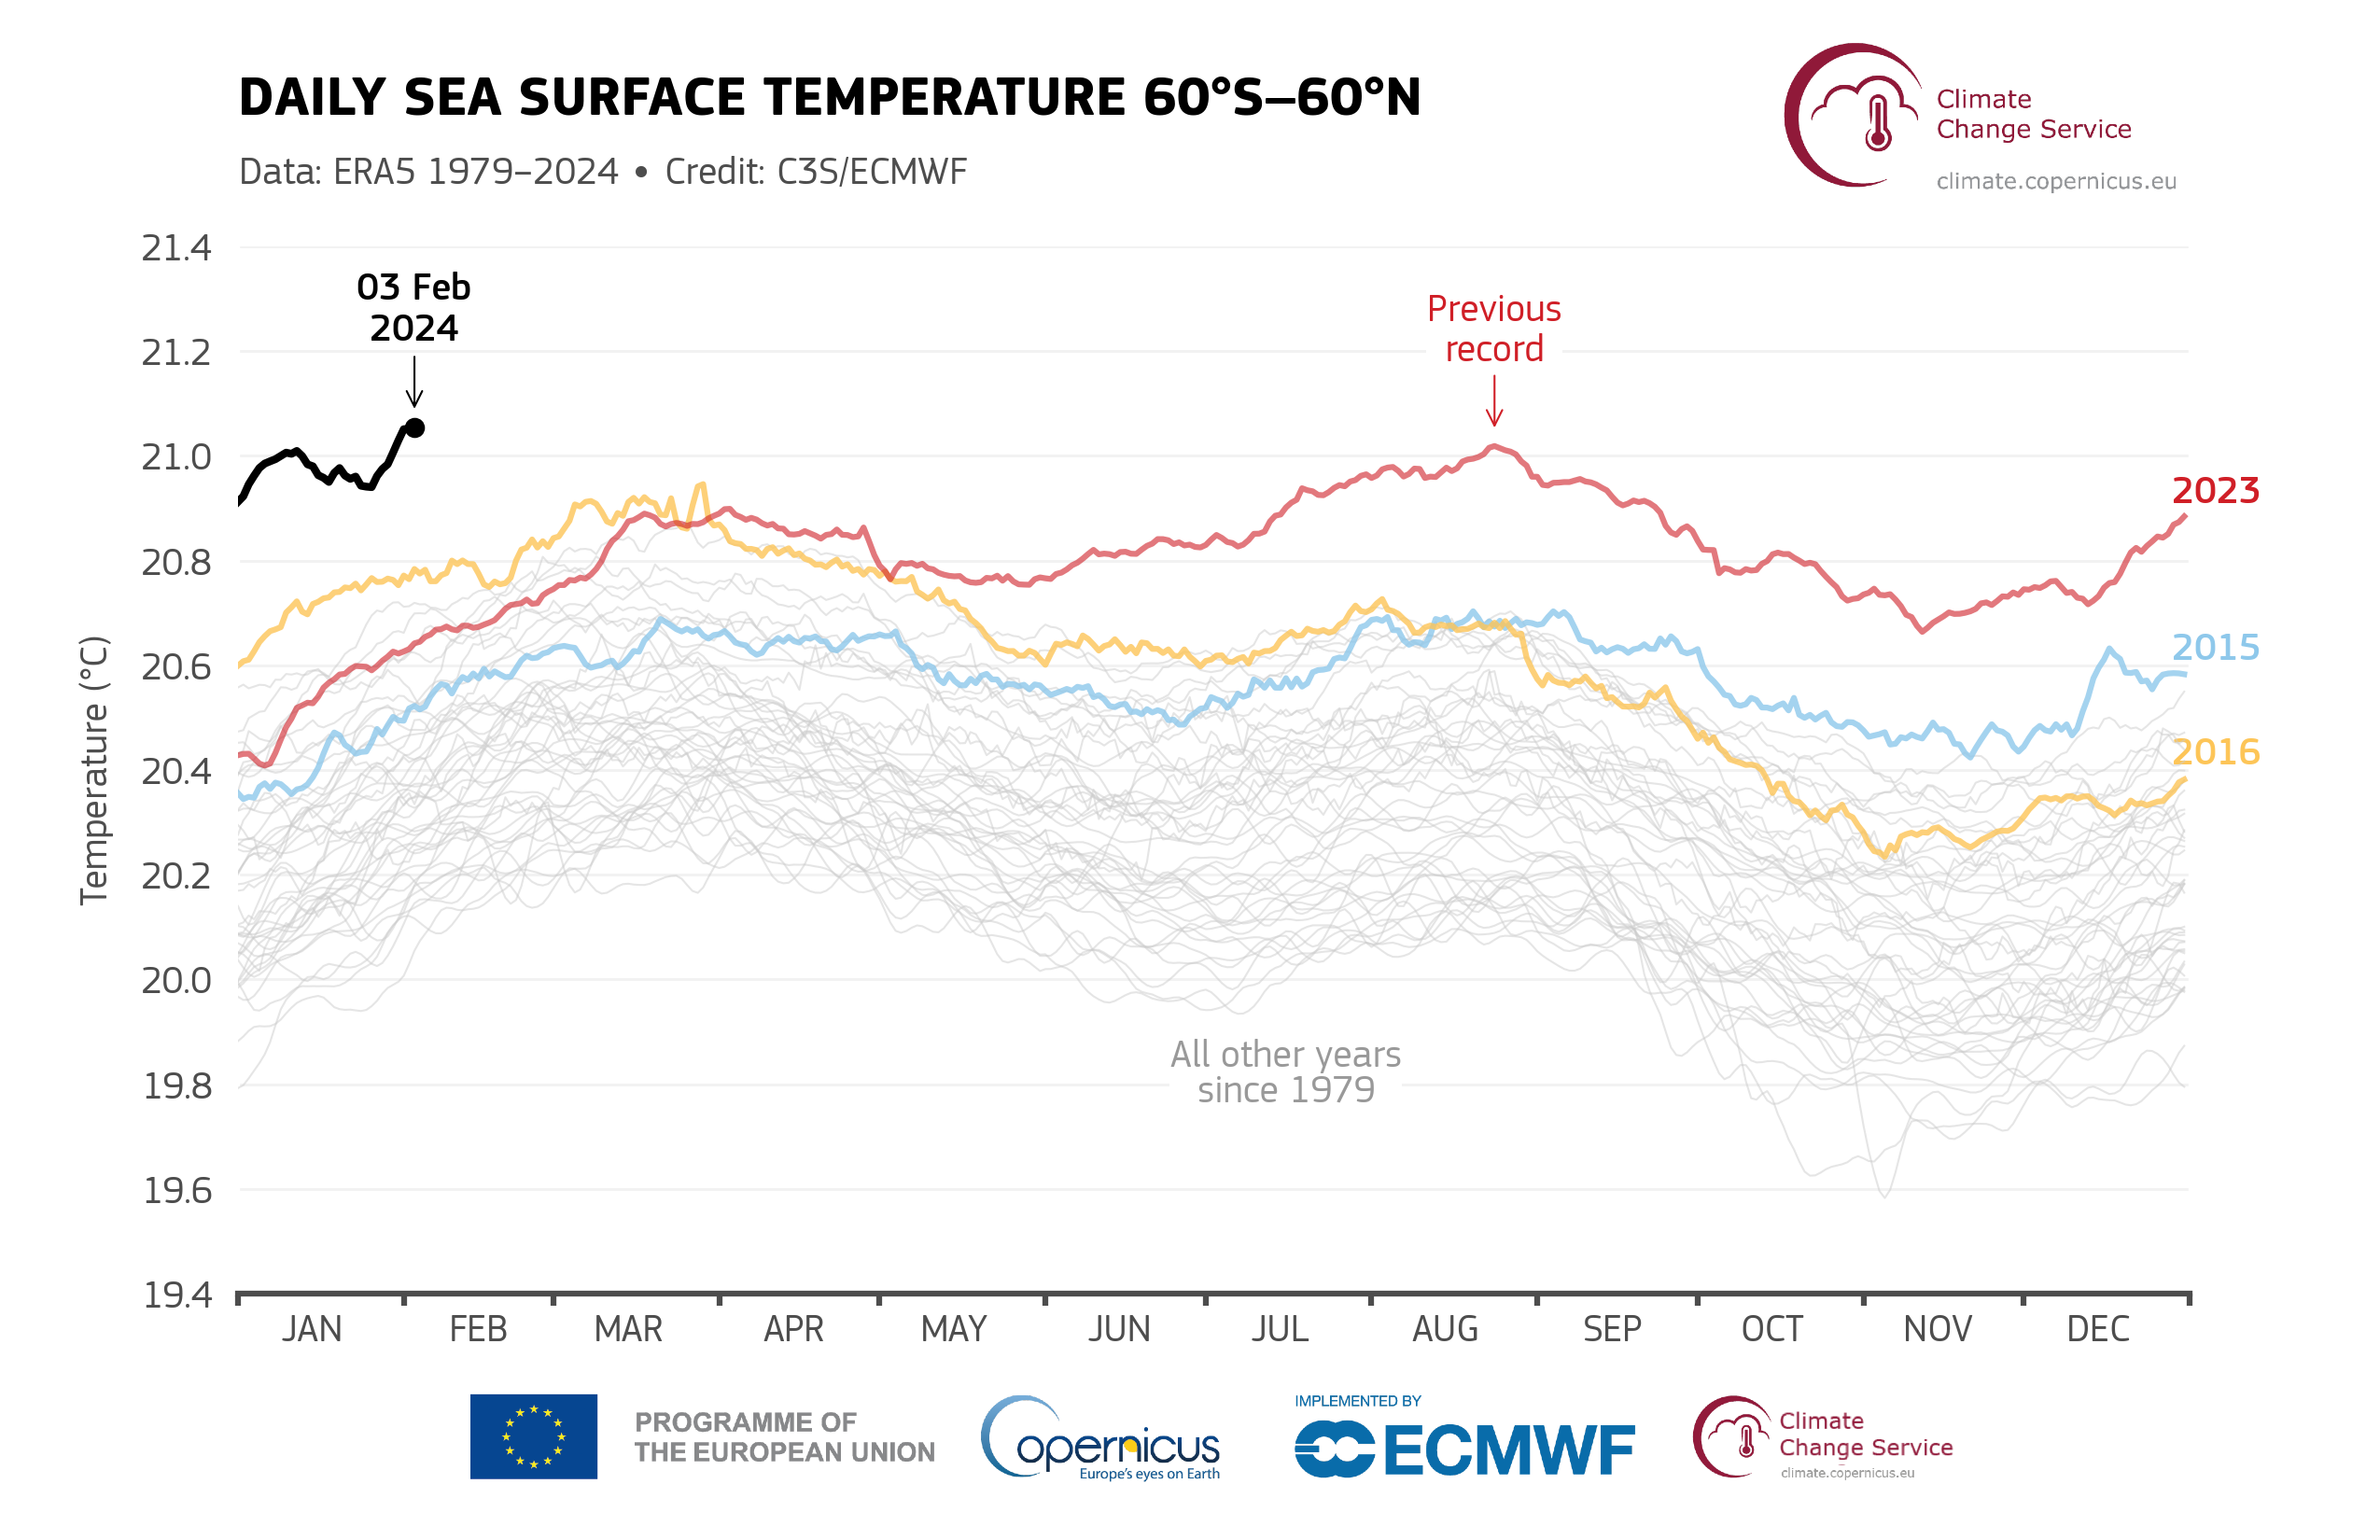
Daily sea surface temperatures continue to rise, click thru for chart.

Notable chart - Daily Sea Surface Temperatures

Line graph of daily sea surface temperature averaged from 60°S to 60°N, plotting every year since 1979. The partial 2024 line, ending 3 February, runs above 2023 — the previous record year, shown in red — for the whole period plotted.
(chart via ECMWF)

via: Copernicus Climate Change Service